In the wake of COVID-19 lockdowns, many places reported a marked increase in air quality. Northern India captured the world’s attention when it was reported that the Himalayan mountain range was visible for the first time in decades. On the flipside, later in the summer, wildfires swept over the Pacific Northwest and California, blanketing entire regions with a thick shroud of smoke that spanned hundreds of miles. How is air quality measured, and what goes into the health scores we see?
Measuring the Air Quality Index
When we see that air quality is “good” or “unhealthy”, those public health categories are derived from the Air Quality Index (AQI). In the U.S., the AQI is calculated using five major air pollutants regulated by the Clean Air Act:
Ground-level ozone Carbon monoxide Sulfur dioxide Particle pollution, also known as particulate matter Nitrogen dioxide
Some countries have a slightly different way of calculating their scores. For example, India also measures levels of ammonia and lead in the air. To make these readings more accessible, the AQI has a scoring system that runs from 0 to 500, using data collected from air monitoring stations in cities around the world. Scores below 50 are considered good, with very little impact to human health. The higher the score gets, the worse the air quality is. To make communicating potential health risks to the public even easier, ranges of scores have been organized into descriptive categories.
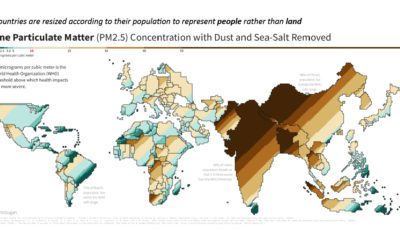
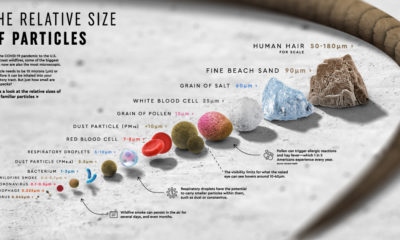
Particulate Matter
While all the forms of atmospheric pollution are a cause for concern, it’s the smaller 2.5μm particles that get the most attention. For one, we can see visible evidence in the form of haze and smoke when PM2.5 levels increase. As well, these fine particles have a much easier time entering our bodies via breathing. There are a number of factors that can increase the concentration of a region’s particulate matter. Some common examples include:
Coal-fired power stations Cooking stoves (Many people around the world burn organic material for cooking and heating) Smoke from wildfires and slash-and-burn land clearing
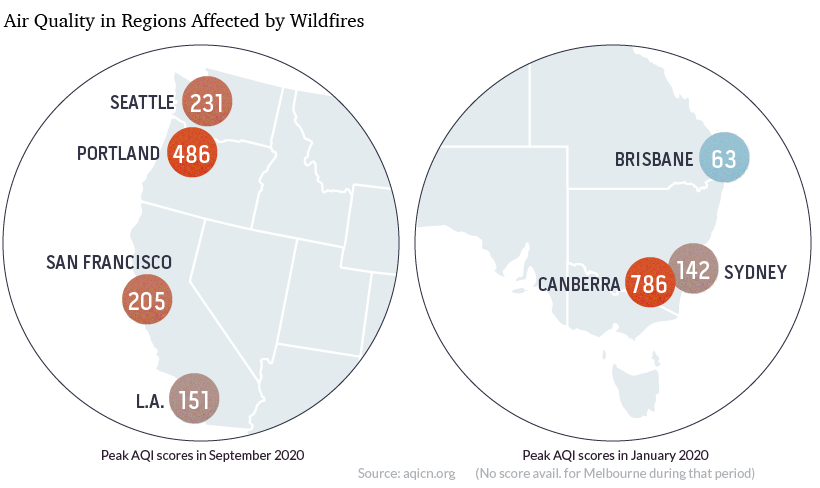
Wildfires and Air Quality
Air quality scores can fluctuate a lot from season to season. For example, regions that are reliant on coal for power generation tend to see AQI score spikes during peak periods. One of the biggest fluctuations occurs during wildfire season, when places that typically have scores in the “good” category can see scores reach unsafe levels. In 2020, Eastern Australia and the West Coast of the U.S. both saw massive drops in air quality during their respective wildfire seasons.
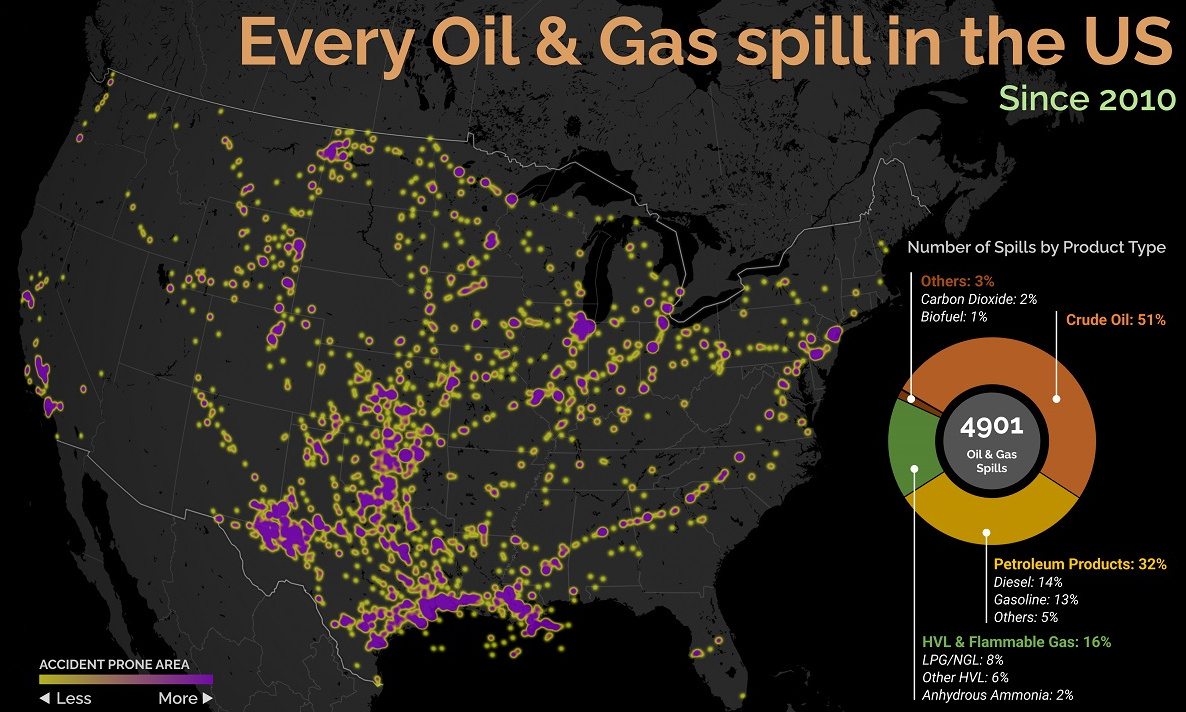
Luckily, while these types of fluctuations are extreme, they are also temporary. Correction: Graphics and article updated to include nitrogen dioxide. on Aside from the obvious climate impact they bring, one other downside in particular is spills, which can lead to ecological and economic damage. These can happen due to pipeline leaks, train derailments, or other industrial disasters. This graphic from Preyash Shah provides a visual overview of every oil and gas spill in the contiguous U.S. since 2010. Data is tracked by the U.S. government’s Pipeline and Hazardous Materials Safety Administration (PHMSA).
U.S. Oil and Gas Spills (2010‒2022)
The majority of spills that have occurred come mostly from crude oil, followed by petroleum products and gas. Note that this data covers the quantity of spills and not damages or volume.
Crude oil, which makes up just over half of documented spills, is also one of the most costly. Contaminations can persist for years after a spill, and its impact on local mammals and waterfowl is particularly harsh. This has been the case with the Deepwater Horizon spill (also known as the “BP oil spill”), which experts say is still causing harm in the Gulf of Mexico. Other products with lots of spills include petroleum products such as diesel or gasoline, as well as liquefied natural gas or other volatile liquids. Interestingly, liquefied carbon dioxide can also be transported in pipelines, commonly used for carbon capture storage, but requires high pressure to maintain its state. When looking at the location of spills, it’s clear that the South Central states have experienced the highest number of disasters. In contrast, the West Coast has had substantially less activity. However, this makes much more sense when looking at the dominant oil producing states, where Texas and surrounding neighbors reign supreme. Of the 4,901 spills during this period, Texas accounts for 1,936 or roughly 40% of all oil and gas spills. This is followed by Oklahoma, which has had 407 spills and is one of the largest net exporters of oil and gas in the country.
What Causes Spills?
Oil and gas spills actually have a surprisingly long history, with one of the earliest dating back to 1889, when a spill was reported on the coast between Los Angeles and San Diego. Causes have consisted primarily of weather, natural disasters, equipment and technological malfunction, as well as human error. However, they only became a widespread problem around the halfway mark of the 20th century, when petroleum extraction and production really began to take off. This era also saw the emergence of supertankers, which can transport half a million tons of oil but therefore make the risk of spills even costlier. In fact, the biggest spill off U.S. waters after the Deepwater Horizon disaster is the 1989 Exxon Valdez spill in Alaska, when a tanker crashed into a reef and 11 million gallons of oil spilled into the Pacific Ocean.