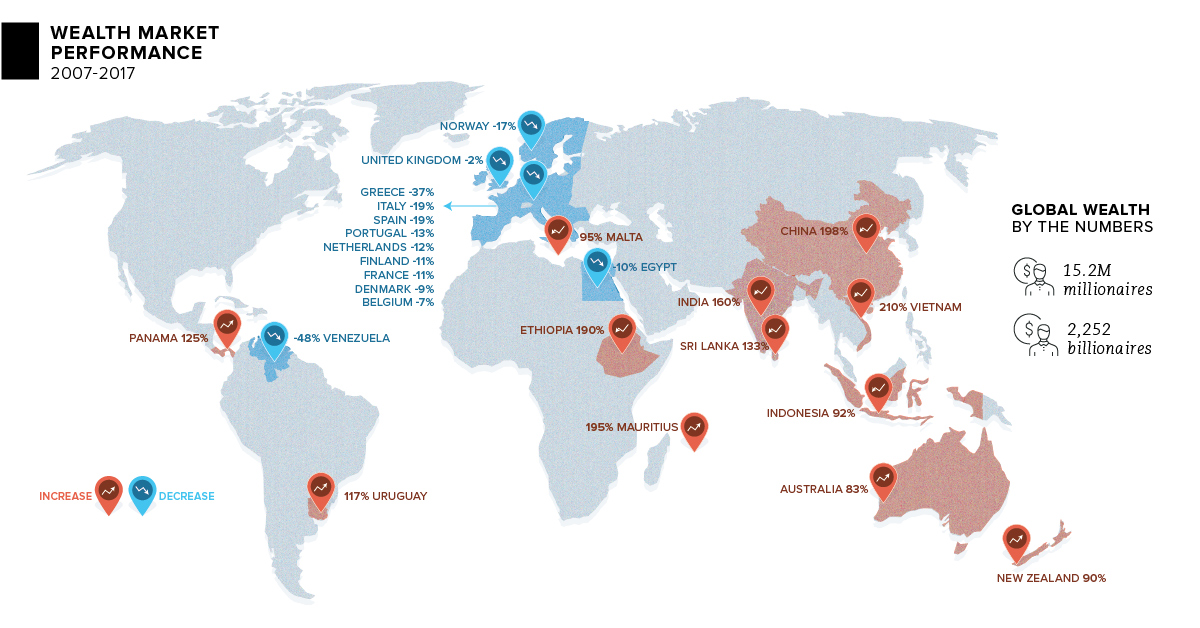
The world has now accumulated $215 trillion in private wealth, a 12% increase over 2017, according to the latest report by market research company New World Wealth. This number today includes wealth held by the general population, as well as the 15.2M millionaires ($1M+ in assets), 584,000 multi-millionaires ($10M+ in assets), and 2,252 billionaires ($1B+ in assets) in the world. But the picture of global wealth hasn’t always been constant – in fact, it’s always shifting based on market performance, the movement of high net worth individuals (HNWIs), demographic trends, and other factors.
Top Countries Adding Wealth
Over the last decade, from 2007 to 2017, here are the top countries based on percentage of new wealth added (in $USD terms): Not surprisingly, plenty of developing markets made this list. Vietnam, which had a 210% growth in wealth held over the last decade, is an emerging manufacturing hub. The market is projected by New World Wealth to grow a further 200% in the next 10 years, bolstered by strong growth in its local healthcare, manufacturing, and financial services sectors. The small island nation of Mauritius is one of Africa’s brightest success stories, with a 195% growth in wealth over the last 10 years. With favorable tax policies, beautiful beaches, and better relative safety ratings, HNWIs have been moving to the island en masse. Just missing the Top 10 list above are two developed economies: New Zealand and Australia. Interestingly, these two markets grew in wealth 90% and 83% respectively over the last decade, which is extremely impressive for countries that already had a solid base of wealth to start with.
Countries That Lost Wealth
Here are the markets that saw total wealth decrease over the last 10 years, in terms of U.S. dollars. The crisis in Venezuela had a particularly rough impact on wealth. The country, which was once the richest in South America, lost 48% of its wealth in $USD terms over the last decade. It’s also worth mentioning that many of the countries that saw wealth decrease over this time period are European – that’s because the 2008 financial crisis (and the ensuing sovereign debt crisis) hit Europe particularly hard. Greece bore the brunt of this impact, losing 37% of its wealth in the 2007-2017 period. on Today’s chart measures the extent to which 41 major economies are reopening, by plotting two metrics for each country: the mobility rate and the COVID-19 recovery rate: Data for the first measure comes from Google’s COVID-19 Community Mobility Reports, which relies on aggregated, anonymous location history data from individuals. Note that China does not show up in the graphic as the government bans Google services. COVID-19 recovery rates rely on values from CoronaTracker, using aggregated information from multiple global and governmental databases such as WHO and CDC.
Reopening Economies, One Step at a Time
In general, the higher the mobility rate, the more economic activity this signifies. In most cases, mobility rate also correlates with a higher rate of recovered people in the population. Here’s how these countries fare based on the above metrics. Mobility data as of May 21, 2020 (Latest available). COVID-19 case data as of May 29, 2020. In the main scatterplot visualization, we’ve taken things a step further, assigning these countries into four distinct quadrants:
1. High Mobility, High Recovery
High recovery rates are resulting in lifted restrictions for countries in this quadrant, and people are steadily returning to work. New Zealand has earned praise for its early and effective pandemic response, allowing it to curtail the total number of cases. This has resulted in a 98% recovery rate, the highest of all countries. After almost 50 days of lockdown, the government is recommending a flexible four-day work week to boost the economy back up.
2. High Mobility, Low Recovery
Despite low COVID-19 related recoveries, mobility rates of countries in this quadrant remain higher than average. Some countries have loosened lockdown measures, while others did not have strict measures in place to begin with. Brazil is an interesting case study to consider here. After deferring lockdown decisions to state and local levels, the country is now averaging the highest number of daily cases out of any country. On May 28th, for example, the country had 24,151 new cases and 1,067 new deaths.
3. Low Mobility, High Recovery
Countries in this quadrant are playing it safe, and holding off on reopening their economies until the population has fully recovered. Italy, the once-epicenter for the crisis in Europe is understandably wary of cases rising back up to critical levels. As a result, it has opted to keep its activity to a minimum to try and boost the 65% recovery rate, even as it slowly emerges from over 10 weeks of lockdown.
4. Low Mobility, Low Recovery
Last but not least, people in these countries are cautiously remaining indoors as their governments continue to work on crisis response. With a low 0.05% recovery rate, the United Kingdom has no immediate plans to reopen. A two-week lag time in reporting discharged patients from NHS services may also be contributing to this low number. Although new cases are leveling off, the country has the highest coronavirus-caused death toll across Europe. The U.S. also sits in this quadrant with over 1.7 million cases and counting. Recently, some states have opted to ease restrictions on social and business activity, which could potentially result in case numbers climbing back up. Over in Sweden, a controversial herd immunity strategy meant that the country continued business as usual amid the rest of Europe’s heightened regulations. Sweden’s COVID-19 recovery rate sits at only 13.9%, and the country’s -93% mobility rate implies that people have been taking their own precautions.
COVID-19’s Impact on the Future
It’s important to note that a “second wave” of new cases could upend plans to reopen economies. As countries reckon with these competing risks of health and economic activity, there is no clear answer around the right path to take. COVID-19 is a catalyst for an entirely different future, but interestingly, it’s one that has been in the works for a while. —Carmen Reinhart, incoming Chief Economist for the World Bank Will there be any chance of returning to “normal” as we know it?