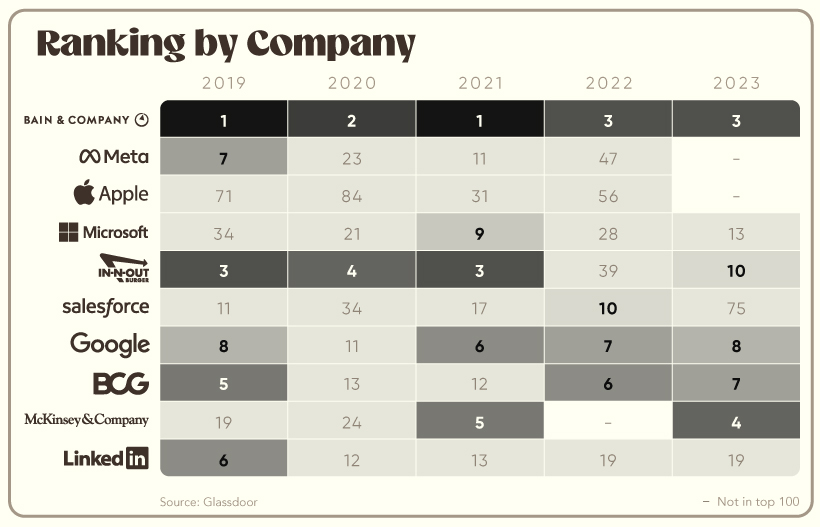
In the above graphic, we dissect how America’s top employers have changed over the last five years based on employee reviews on Glassdoor, a website that allows current and former employees to anonymously review their employers on things like company culture, pay, benefits, diversity, and more.
Tech Fares Best
Despite widescale layoffs in 2022, technology companies made up more than 40% of Glassdoor’s Best Places to Work list in 2023. Gainsight, a customer success software company founded in 2009, entered the top 15 ranking for the first time in five years and took the number one spot as the year’s best employer. The dominance of technology companies in Glassdoor’s Best Places to Work list is nothing new, though. Companies like HubSpot and NVIDIA are staples on the list, with consistent praise from their employees when it comes to pay, benefits, leadership, and career growth. While tech tends to be popular among employees, the industry isn’t the end-all-be-all when it comes to good employee reviews. Take Bain & Company, a management consulting firm with over 10,000 employees, that’s been consistently ranking in the top three over the last five years. Or look at fast-food chain In-N-Out Burger, whose employees consistently rave about good pay and schedule flexibility in anonymous Glassdoor reviews, making the company one of America’s top 20 employers since 2015.
Analyzing Ranking by Company
Diving into the ranking by company can also give us a good understanding of how some of the giants compare to others in the field.
Looking at the above visual, you might notice that two regular winners, Apple and Meta, did not make the top 100 this year. Salesforce’s ranking also fell below the top 50 for the first time since 2015, coming in at #75. While tech fared relatively well in 2023, these companies tumbled down and off the list, making way for smaller tech companies like Gainsight, Box, and MathWorks. As the global economy faces uncertainty in 2023, it’ll be interesting to observe how these companies fare in terms of employee satisfaction. Against the backdrop of layoffs and slower economic growth, how leadership navigates hard conversations and steps up for their employees may be very telling, potentially resulting in a completely different makeup of the list in 2024. on Last year, stock and bond returns tumbled after the Federal Reserve hiked interest rates at the fastest speed in 40 years. It was the first time in decades that both asset classes posted negative annual investment returns in tandem. Over four decades, this has happened 2.4% of the time across any 12-month rolling period. To look at how various stock and bond asset allocations have performed over history—and their broader correlations—the above graphic charts their best, worst, and average returns, using data from Vanguard.
How Has Asset Allocation Impacted Returns?
Based on data between 1926 and 2019, the table below looks at the spectrum of market returns of different asset allocations:
We can see that a portfolio made entirely of stocks returned 10.3% on average, the highest across all asset allocations. Of course, this came with wider return variance, hitting an annual low of -43% and a high of 54%.
A traditional 60/40 portfolio—which has lost its luster in recent years as low interest rates have led to lower bond returns—saw an average historical return of 8.8%. As interest rates have climbed in recent years, this may widen its appeal once again as bond returns may rise.
Meanwhile, a 100% bond portfolio averaged 5.3% in annual returns over the period. Bonds typically serve as a hedge against portfolio losses thanks to their typically negative historical correlation to stocks.
A Closer Look at Historical Correlations
To understand how 2022 was an outlier in terms of asset correlations we can look at the graphic below:
The last time stocks and bonds moved together in a negative direction was in 1969. At the time, inflation was accelerating and the Fed was hiking interest rates to cool rising costs. In fact, historically, when inflation surges, stocks and bonds have often moved in similar directions. Underscoring this divergence is real interest rate volatility. When real interest rates are a driving force in the market, as we have seen in the last year, it hurts both stock and bond returns. This is because higher interest rates can reduce the future cash flows of these investments. Adding another layer is the level of risk appetite among investors. When the economic outlook is uncertain and interest rate volatility is high, investors are more likely to take risk off their portfolios and demand higher returns for taking on higher risk. This can push down equity and bond prices. On the other hand, if the economic outlook is positive, investors may be willing to take on more risk, in turn potentially boosting equity prices.
Current Investment Returns in Context
Today, financial markets are seeing sharp swings as the ripple effects of higher interest rates are sinking in. For investors, historical data provides insight on long-term asset allocation trends. Over the last century, cycles of high interest rates have come and gone. Both equity and bond investment returns have been resilient for investors who stay the course.