The ECB’s Big Bazookas (TLTRO & QE)
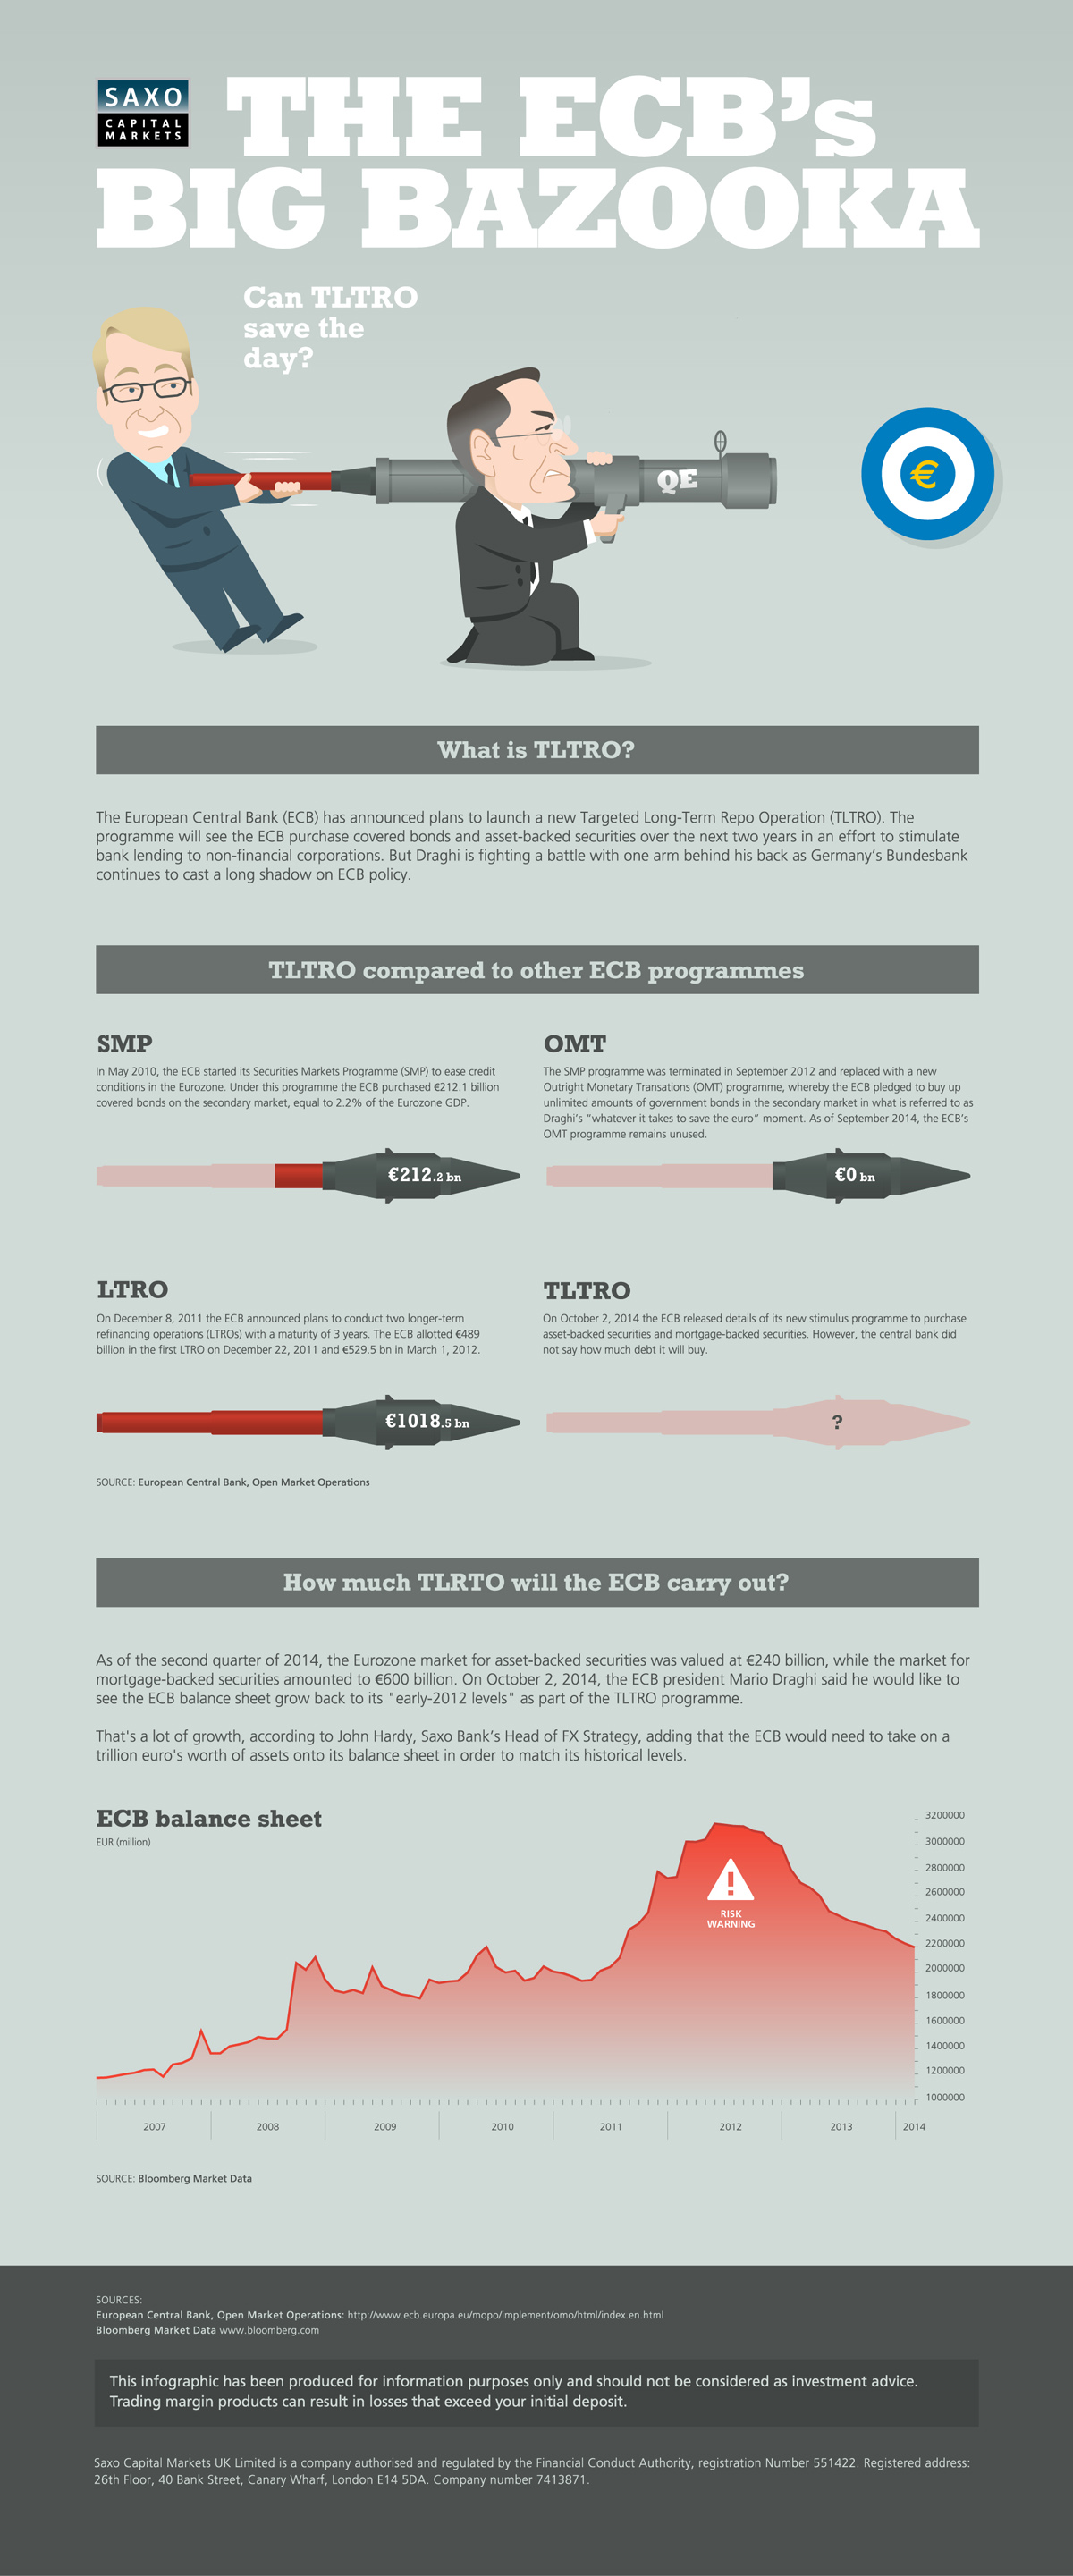
The Eurozone is on the rocks again. In November, business activity fell to its lowest point in 16 months as the Purchasing Managers Index (PMI) dropped to 51.1. The Euro is at a 27 month low against the dollar. Unemployment is stuck at 11.5%. Making matters worse, deflation is also knocking on the door. In November, prices rose just 0.3% from the previous year, which is far below the 2% target. Nicholas Spiro, managing director of Spiro Sovereign Strategy in London, says, “the data show(s) that the Japanification of the Eurozone remains apace.” To combat this, The European Central Bank (ECB) has decided to pull out the big guns. The first big gun, in some of the best “Fedspeak” we’ve seen yet is called Targeted Long-Term Refinancing Operations (TLTRO). Banks are able to borrow from the ECB at very low rates if the money is eventually lent to companies, and not for mortgages or buying government debt. However, since the TLTROs started, results have not been as the ECB has hoped. This is why Mario Draghi and his counterparts have hinted at a bigger bazooka, quantitative easing (QE), over the last few weeks. Tomorrow (Dec 4th) they may decide to finally pull the trigger at the ECB meeting, but some feel that is premature. “Much like an elementary school student putting off their weekend homework in hopes of a ‘miracle’ snow day canceling school on Monday, the ECB can still hang it’s hopes on the mid-December TLTRO auction as a possible savior,” said Matt Weller, senior technical analyst at Forex.com, in a note. Original graphic from: Saxo Markets
Other VC Posts
A Crude Problem For Putin’s Russia on Last year, stock and bond returns tumbled after the Federal Reserve hiked interest rates at the fastest speed in 40 years. It was the first time in decades that both asset classes posted negative annual investment returns in tandem. Over four decades, this has happened 2.4% of the time across any 12-month rolling period. To look at how various stock and bond asset allocations have performed over history—and their broader correlations—the above graphic charts their best, worst, and average returns, using data from Vanguard.
How Has Asset Allocation Impacted Returns?
Based on data between 1926 and 2019, the table below looks at the spectrum of market returns of different asset allocations:
We can see that a portfolio made entirely of stocks returned 10.3% on average, the highest across all asset allocations. Of course, this came with wider return variance, hitting an annual low of -43% and a high of 54%.
A traditional 60/40 portfolio—which has lost its luster in recent years as low interest rates have led to lower bond returns—saw an average historical return of 8.8%. As interest rates have climbed in recent years, this may widen its appeal once again as bond returns may rise.
Meanwhile, a 100% bond portfolio averaged 5.3% in annual returns over the period. Bonds typically serve as a hedge against portfolio losses thanks to their typically negative historical correlation to stocks.
A Closer Look at Historical Correlations
To understand how 2022 was an outlier in terms of asset correlations we can look at the graphic below:
The last time stocks and bonds moved together in a negative direction was in 1969. At the time, inflation was accelerating and the Fed was hiking interest rates to cool rising costs. In fact, historically, when inflation surges, stocks and bonds have often moved in similar directions. Underscoring this divergence is real interest rate volatility. When real interest rates are a driving force in the market, as we have seen in the last year, it hurts both stock and bond returns. This is because higher interest rates can reduce the future cash flows of these investments. Adding another layer is the level of risk appetite among investors. When the economic outlook is uncertain and interest rate volatility is high, investors are more likely to take risk off their portfolios and demand higher returns for taking on higher risk. This can push down equity and bond prices. On the other hand, if the economic outlook is positive, investors may be willing to take on more risk, in turn potentially boosting equity prices.
Current Investment Returns in Context
Today, financial markets are seeing sharp swings as the ripple effects of higher interest rates are sinking in. For investors, historical data provides insight on long-term asset allocation trends. Over the last century, cycles of high interest rates have come and gone. Both equity and bond investment returns have been resilient for investors who stay the course.