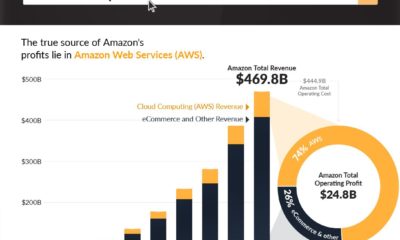
Winemaking is often thought of as a symbol of transformation. While the fermented drink dates back 9,000 years, the wine market is now experiencing its own transformation due to technological innovation, and the introduction of new business models. Generating $370 billion in revenue in 2019, the global industry is expected to grow considerably over the next decade—but not as we know it. Today’s infographic from Raconteur explores wine consumption by region, and looks at how changing tastes are driving a new era of the millennia-old staple. Will the industry continue to get better with age, or will it join the countless other industries that have fallen victim to disruption?
The Wine Leaders of the World
To start, let’s take a look at the countries around the world that have the biggest economic footprints linked to the trade and consumption of wine: Exports: Spain is the largest exporter of wine globally, producing 21 million hectoliters of volume in 2018, followed by Italy with 19.7 million hectoliters. Imports: Germany leads on imports with 14.5 million hectoliters of volume in 2018, while the UK is the second-largest importer with 13.2 million hectoliters. Consumption: The U.S. currently leads on wine consumption, with Americans drinking an average of 3.7 liters per person—generating almost $50 billion in revenue. Currently, 80% of all wine consumed within China is produced domestically, and with a growing middle class, there is a huge potential for the Chinese industry to gain ground in comparison to other leading wine markets.
Rapidly Changing Tastes
While older generations prefer wine to other alcoholic beverages, spirits are the drink of choice for those aged 18 to 27. In fact, only 27% of this age group prefers wine to spirits or beer, meaning wine companies will need to adapt to these younger audiences and their differing values. Marketing could create an opportunity to connect with this audience in a more meaningful way, with packaging having the most potential to sway their decision making process by providing a number of unique benefits:
Sustainability Smaller serving sizes Portability
Interestingly, canned wine is already a $70 million industry in the United States — and by 2025, it could make up 10% of total sales.
New Threats to the Industry
Along with changing expectations for packaging, millennials also crave new experiences, with more alternative options appealing to this age group, such as cannabis-infused beverages, craft beer, and whiskey. Dealcoholized cannabis-infused wine is a new product innovation that could also appeal to this audience and have direct implications for the industry—but while cannabis companies have shown an interest in the category, collaboration with the tech industry is proving to be the most transformative.
When Two Valleys Collide
Technology is squeezing every opportunity it can get out of the wine industry, impacting different parts of the supply chain.
Winemaking
Drones are making farms and vineyards across the globe more efficient, while new technologies used to improve harvesting, sorting, and filtration during the winemaking process are also cropping up and providing new solutions to antiquated problems.
Consumption
Traditionally, decanting wine has been a slow and delicate process. Smart wine decanters however, can expedite that process. These decanters use air filtration systems to remove impurities and enhance the aroma in just a few minutes—streamlining the decanting process, which typically takes around three hours.
Impact on the Environment
Industry experts predict that packaging such as edible bottles made from sugar substitutes, and compostable, non-plastic glass will replace glass bottles. Meanwhile, QR codes have the potential to replace paper labels on wine bottles entirely, and a growing number of wine brands are already using augmented reality to deliver more immersive experiences to end consumers. For an industry steeped in history and tradition, the future holds exciting potential for new innovations that will transform the way we look at wine forever. on Last year, stock and bond returns tumbled after the Federal Reserve hiked interest rates at the fastest speed in 40 years. It was the first time in decades that both asset classes posted negative annual investment returns in tandem. Over four decades, this has happened 2.4% of the time across any 12-month rolling period. To look at how various stock and bond asset allocations have performed over history—and their broader correlations—the above graphic charts their best, worst, and average returns, using data from Vanguard.
How Has Asset Allocation Impacted Returns?
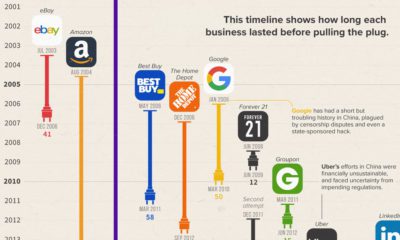
Based on data between 1926 and 2019, the table below looks at the spectrum of market returns of different asset allocations:
We can see that a portfolio made entirely of stocks returned 10.3% on average, the highest across all asset allocations. Of course, this came with wider return variance, hitting an annual low of -43% and a high of 54%.
A traditional 60/40 portfolio—which has lost its luster in recent years as low interest rates have led to lower bond returns—saw an average historical return of 8.8%. As interest rates have climbed in recent years, this may widen its appeal once again as bond returns may rise.
Meanwhile, a 100% bond portfolio averaged 5.3% in annual returns over the period. Bonds typically serve as a hedge against portfolio losses thanks to their typically negative historical correlation to stocks.
A Closer Look at Historical Correlations
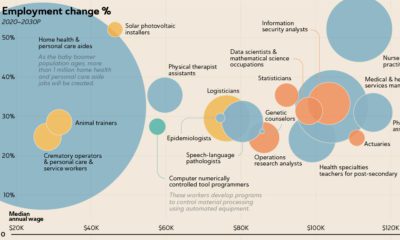
To understand how 2022 was an outlier in terms of asset correlations we can look at the graphic below:
The last time stocks and bonds moved together in a negative direction was in 1969. At the time, inflation was accelerating and the Fed was hiking interest rates to cool rising costs. In fact, historically, when inflation surges, stocks and bonds have often moved in similar directions. Underscoring this divergence is real interest rate volatility. When real interest rates are a driving force in the market, as we have seen in the last year, it hurts both stock and bond returns. This is because higher interest rates can reduce the future cash flows of these investments. Adding another layer is the level of risk appetite among investors. When the economic outlook is uncertain and interest rate volatility is high, investors are more likely to take risk off their portfolios and demand higher returns for taking on higher risk. This can push down equity and bond prices. On the other hand, if the economic outlook is positive, investors may be willing to take on more risk, in turn potentially boosting equity prices.
Current Investment Returns in Context
Today, financial markets are seeing sharp swings as the ripple effects of higher interest rates are sinking in. For investors, historical data provides insight on long-term asset allocation trends. Over the last century, cycles of high interest rates have come and gone. Both equity and bond investment returns have been resilient for investors who stay the course.