While China’s economy has had a much rockier start this year due to zero-tolerance COVID-19 lockdowns and supply chain issues, our visualization covers a full year of data for 2021—a year in which most economies recovered after the initial chaos of the pandemic. In 2021, China’s Gross Domestic Product (GDP) reached ¥114 trillion ($18 trillion in USD), according to the National Bureau of Statistics. The country’s economy outperformed government targets of 6% growth, with the overall economy growing by 8.1%. Let’s take a look at what powers China’s modern economy.
Breaking Down China’s Economy By Sector
Industrial production—activity in the manufacturing, mining, and utilities sectors—is by far the leading driver of China’s economy. In 2021, the sector generated ¥37.3 trillion, or one-third of the country’s total economic activity. Despite a slowdown in December, wholesale and retail trades also performed strongly in 2021. As the main gauge of consumption, it was affected by lockdown measures and the spread of the COVID-19 Omicron variant towards the end of the year, but still rose by double digits, reaching a total of ¥10.5 trillion*. “Other services”, which includes everything from scientific research and development to education and social services, generated 16% of China’s total economy in 2021, or ¥18.1 trillion. *Editor’s note: At time of publishing, China’s government seems to have since adjusted this number to ¥11.0 trillion, which is not consistent with the original data set provided, but worth noting.
Where is China’s GDP Headed?
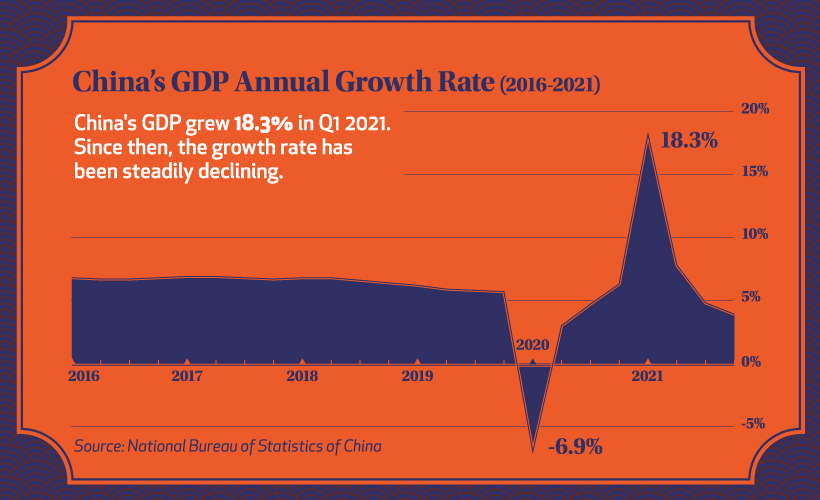
China’s economy recovered noticeably faster than most major economies last year, and as the overall trend below shows, the country has grown consistently in the years prior.
Before the pandemic hit, China’s quarterly GDP growth had been quite stable at just above 5%. After the initial onset of COVID-19, the country’s economy faltered, mirroring economies around the globe. But after a strong recovery into 2021, resurging cases caused a new series of crackdowns on the private sector, slowing down GDP growth considerably. With the slowdown continuing into early 2022, China’s economic horizon still looks uncertain. The lockdown in Shanghai is expected to continue all the way to June 1st, and over recent months there have been hundreds of ships stuck outside of Shanghai’s port as a part of ongoing supply chain challenges.
China’s Zero-COVID Policy: Good or Bad for the Economy?
While every country reacted to the COVID-19 pandemic differently, China adopted a zero-COVID policy of strict lockdowns to control cases and outbreaks. For most of 2021, the policy didn’t deter GDP growth. Despite some major cities fully or partially locked down to control regional outbreaks, the country’s economy still paced well ahead of many other major economies. But the policy faced a challenge with the emergence of the Omicron variant. Despite lockdowns and an 88% vaccination rate nationally, seven out of China’s 31 provinces and all of the biggest cities have reported Omicron cases. And China’s zero-COVID policy has not affected all sectors equally. Industrial production rose by more than 10% in the first 11 months of 2021, despite city lockdowns around the country. That’s because many factories in China are in suburban industrial parks outside the cities, and employees often live nearby. But many sectors like hotels and restaurants have been more severely affected by city lockdowns. Many global economies are starting to transition to living with COVID, with China remaining as one of the last countries to follow a zero-COVID policy. Does that ensure the country’s economy will continue to slow in 2022, or will China manage to recover and maintain one of the world’s fastest growing economies? on Last year, stock and bond returns tumbled after the Federal Reserve hiked interest rates at the fastest speed in 40 years. It was the first time in decades that both asset classes posted negative annual investment returns in tandem. Over four decades, this has happened 2.4% of the time across any 12-month rolling period. To look at how various stock and bond asset allocations have performed over history—and their broader correlations—the above graphic charts their best, worst, and average returns, using data from Vanguard.
How Has Asset Allocation Impacted Returns?
Based on data between 1926 and 2019, the table below looks at the spectrum of market returns of different asset allocations:
We can see that a portfolio made entirely of stocks returned 10.3% on average, the highest across all asset allocations. Of course, this came with wider return variance, hitting an annual low of -43% and a high of 54%.
A traditional 60/40 portfolio—which has lost its luster in recent years as low interest rates have led to lower bond returns—saw an average historical return of 8.8%. As interest rates have climbed in recent years, this may widen its appeal once again as bond returns may rise.
Meanwhile, a 100% bond portfolio averaged 5.3% in annual returns over the period. Bonds typically serve as a hedge against portfolio losses thanks to their typically negative historical correlation to stocks.
A Closer Look at Historical Correlations
To understand how 2022 was an outlier in terms of asset correlations we can look at the graphic below:
The last time stocks and bonds moved together in a negative direction was in 1969. At the time, inflation was accelerating and the Fed was hiking interest rates to cool rising costs. In fact, historically, when inflation surges, stocks and bonds have often moved in similar directions. Underscoring this divergence is real interest rate volatility. When real interest rates are a driving force in the market, as we have seen in the last year, it hurts both stock and bond returns. This is because higher interest rates can reduce the future cash flows of these investments. Adding another layer is the level of risk appetite among investors. When the economic outlook is uncertain and interest rate volatility is high, investors are more likely to take risk off their portfolios and demand higher returns for taking on higher risk. This can push down equity and bond prices. On the other hand, if the economic outlook is positive, investors may be willing to take on more risk, in turn potentially boosting equity prices.
Current Investment Returns in Context
Today, financial markets are seeing sharp swings as the ripple effects of higher interest rates are sinking in. For investors, historical data provides insight on long-term asset allocation trends. Over the last century, cycles of high interest rates have come and gone. Both equity and bond investment returns have been resilient for investors who stay the course.