Fluctuations in its price, which is typically quoted in USD/1,000 board feet (bd ft), can significantly affect the housing industry and in turn, influence the broader U.S. economy. To understand the impact that lumber prices can have, we’ve visualized the number of homes that can be built with $50,000 worth of lumber, one year apart.
A Story of Supply and Demand
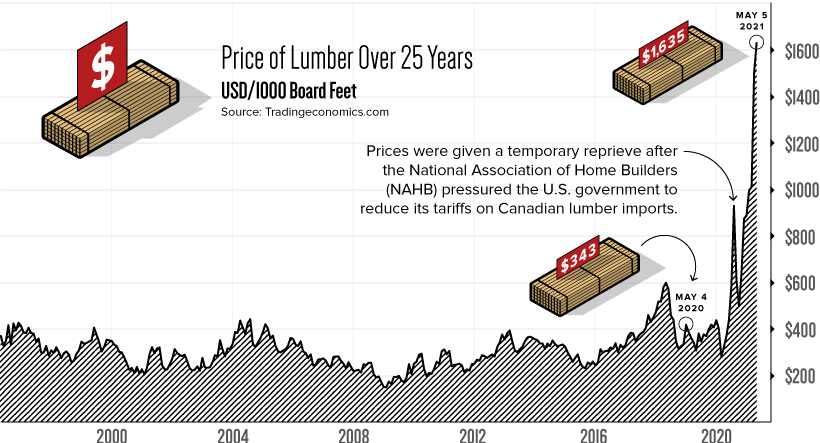
Before discussing the infographic above, it’s important to understand the market’s current environment. In just one year, the price of lumber has increased 377%—reaching a record high of $1,635 per 1,000 bd ft. For context, lumber has historically fluctuated between $200 to $400.
To understand what’s driving lumber prices to new heights, let’s look at two economic elements: supply and demand.
Shortened Supply
U.S. lumber supplies came under pressure in April 2017, when the Trump administration raised tariffs on Canadian lumber. Since then, lumber imports have fallen and prices have experienced significant volatility. After a brief stint above $600 in April 2018, lumber quickly tumbled down to sub $250 levels, causing a number of sawmills to shut down. The resulting decreases in production capacity (supply) were estimated to be around 3 billion board feet. Once COVID-19 emerged, labor shortages cut production even further, making the lumber market incredibly sensitive to demand shocks. The U.S. government has since reduced its tariffs on Canadian lumber, but these measures appear to be an example of too little, too late.
Pent-up Demand
Against expectations, COVID-19 has led to a significant boom in housing markets, greatly increasing the need for lumber. Lockdowns in early 2020 delayed many home purchases until later in the year, while increased savings rates during the pandemic meant Americans had more cash on hand. The demand for homes was further amplified by record-low mortgage rates across the country. Existing homeowners needed lumber too, as many Americans suddenly found themselves requiring upgrades and renovations to accommodate their new stay-at-home lifestyles.
How Many Homes Can You Build With $50K of Lumber?
To see how burgeoning lumber prices are impacting the U.S. housing market, we’ve calculated the number of single family homes that could be built with $50,000 worth of lumber. First, we established the following parameters:
Lumber requirements: 6.3 board feet (bd ft) per square foot (sq ft) Median single family house size: 2,301 sq ft Total lumber required per single family house: 14,496 bd ft
Based on these parameters, here’s how many single family homes can be built with $50,000 worth of lumber: *Exact matching dates were not available for past years. Source: Insider As lumber prices continue to set record highs, the National Association of Home Builders (NAHB) has reported that the cost to build a single family home has increased by $36,000. Most of this cost can be passed down to the consumer, but extremely tight supplies mean homebuilders are unable to start more projects.
The Clock is Ticking
Despite their best efforts to increase output, it’s likely that sawmills across the U.S. will continue playing catch-up in 2021. Analysts are now warning that lumber prices could reach a flashpoint, where affordability becomes so limited that demand suddenly falls off. This has led the NAHB to ask the Biden administration for a temporary pause on Canadian lumber tariffs, which currently sit at 9%. U.S. tariffs on Canadian lumber were first introduced in 1982, and represent one of the longest lasting trade wars between the two nations. The U.S. is currently appealing a World Trade Organization (WTO) ruling that states its 2017 tariff hike was a breach of global trading rules. on Last year, stock and bond returns tumbled after the Federal Reserve hiked interest rates at the fastest speed in 40 years. It was the first time in decades that both asset classes posted negative annual investment returns in tandem. Over four decades, this has happened 2.4% of the time across any 12-month rolling period. To look at how various stock and bond asset allocations have performed over history—and their broader correlations—the above graphic charts their best, worst, and average returns, using data from Vanguard.
How Has Asset Allocation Impacted Returns?
Based on data between 1926 and 2019, the table below looks at the spectrum of market returns of different asset allocations:
We can see that a portfolio made entirely of stocks returned 10.3% on average, the highest across all asset allocations. Of course, this came with wider return variance, hitting an annual low of -43% and a high of 54%.
A traditional 60/40 portfolio—which has lost its luster in recent years as low interest rates have led to lower bond returns—saw an average historical return of 8.8%. As interest rates have climbed in recent years, this may widen its appeal once again as bond returns may rise.
Meanwhile, a 100% bond portfolio averaged 5.3% in annual returns over the period. Bonds typically serve as a hedge against portfolio losses thanks to their typically negative historical correlation to stocks.
A Closer Look at Historical Correlations
To understand how 2022 was an outlier in terms of asset correlations we can look at the graphic below:
The last time stocks and bonds moved together in a negative direction was in 1969. At the time, inflation was accelerating and the Fed was hiking interest rates to cool rising costs. In fact, historically, when inflation surges, stocks and bonds have often moved in similar directions. Underscoring this divergence is real interest rate volatility. When real interest rates are a driving force in the market, as we have seen in the last year, it hurts both stock and bond returns. This is because higher interest rates can reduce the future cash flows of these investments. Adding another layer is the level of risk appetite among investors. When the economic outlook is uncertain and interest rate volatility is high, investors are more likely to take risk off their portfolios and demand higher returns for taking on higher risk. This can push down equity and bond prices. On the other hand, if the economic outlook is positive, investors may be willing to take on more risk, in turn potentially boosting equity prices.
Current Investment Returns in Context
Today, financial markets are seeing sharp swings as the ripple effects of higher interest rates are sinking in. For investors, historical data provides insight on long-term asset allocation trends. Over the last century, cycles of high interest rates have come and gone. Both equity and bond investment returns have been resilient for investors who stay the course.